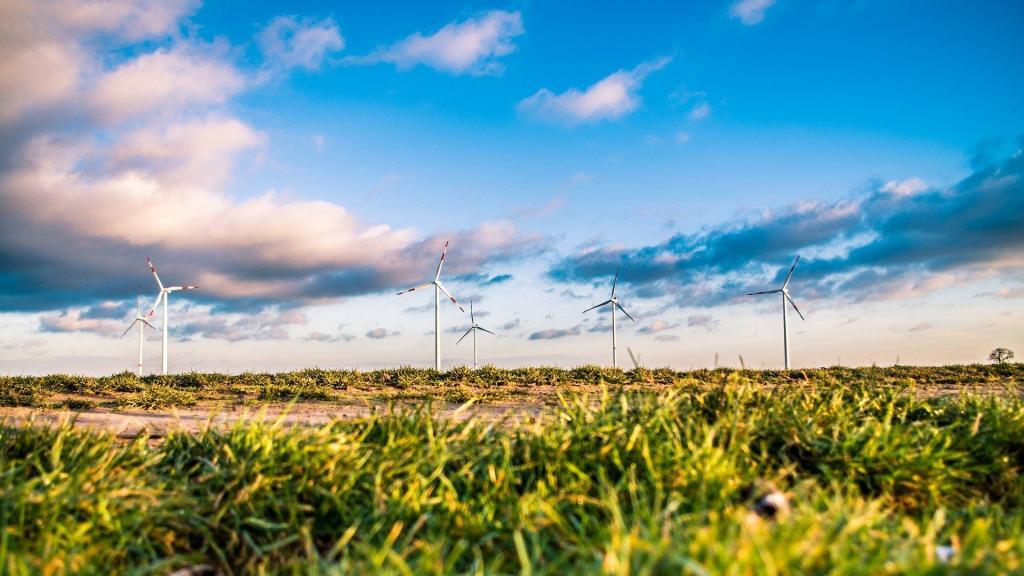
The North Sea coast – endless expanse, long sandy beaches, healthy salty air, mudflats, small islands, pretty villages, pretty towns, and many wind farms. As one of the most promising renewable energy sources, electrical energy is generated here from wind power. As a green energy producer, wind energy makes a valuable and sustainable contribution to the energy transition, also a kind of efficient energy management.
I have been invited to a workshop in Cuxhaven by our technology partner, Frank Höpcke Haus und Technik GmbH. The content today is about use cases for energy management. We want to enable a further entry of our open-source-based No-Code platform titan with Energy ideas into the Internet of Things (IoT).
The reception area at Frank Höpcke’s makes a good impression, designed to be modern and technologically up to date. The company founder greets me warmly at an appropriate distance and my eyes wander directly to the large screen, which cannot be overlooked on the large wall to the left of the reception desk.
CO2-Neutral – Small solution with a big effect
“This is my contribution to CO2-neutrality,” Frank Höpcke begins our conversation. “We only work with electricity in our office building and even generate it ourselves,” Frank Höpcke continues. “We have placed a photovoltaic plant with 10 KW power on the roof, our “greenhouse”, which was built in timber frame construction, has a super k-value. This is usually called U-value today and describes the so-called heat transfer coefficient. It gives information about how well a wall is insulated or what effects additional insulation has.” I’m amazed, and Frank Höpcke elaborates: “Our company building faces east/west. Therefore, we have sun all day long. And when the building is not occupied, the blinds open depending on the position of the sun. We then simply heat with the solar energy via the windows,” as Frank Höpcke so casually puts it.
Green Building concept – the excess power to the cloud
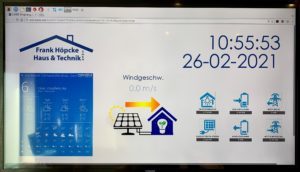
The entrepreneur now takes me by the hand at a distance, so to speak, and we make our way to the technical center. Once we arrive there, I am all the more amazed. The building is heated in regular operation via heat pumps. The 7.5 KW electricity storage system with an inverter takes in the solar energy from the roof. At night, the electricity is then taken from the storage’s batteries. Experience has shown that more electricity is generated than is needed. The “excess” power is fed into the external grid into a “power cloud”. In winter the power is then drawn from the cloud. All these data and status messages as well as weather information are shown on the display in the foyer. The annual consumption is about 5,500 kWh. That’s not a lot of energy consumption, and Frank Höpcke is justifiably proud of his Green Building concept. A Small solution, with a big effect. We drink our first pot of coffee in the meeting room.
What exactly is energy management?
The term energy management refers to the product of various measures and strategies utilizing which energy can be procured, distributed and used. The primary interest here is the intention to reduce energy consumption and optimize energy efficiency to achieve economic and ecological goals.
Comprehensive energy management addresses both technical and structural standards and the interface between the digital recording of relevant consumption data and its evaluation. Last but not least, human behavior also plays a role. As a result, energy management is becoming increasingly relevant not only at the political, institutional, and business management levels but also for individuals.
In some cases, terms such as “energy controlling” or “energy monitoring” are used in connection with energy management, which does not make it easy to draw a distinction and has given rise to a large number of different definitions. Controlling and monitoring, however, focus primarily on the evaluation or collection of data – they thus cover only parts of the scope of holistic energy management. A definition that, in addition to the economic dimension, also considers ecological aspects, for example, can be found in the guideline “VDI 4602” of the Association of German Engineers (VDI).
Keeping an eye on energy efficiency with standards
An energy management system allows energy consumption to be recorded digitally, potential savings to be identified and efficiency-enhancing measures to be implemented. It is not mandatory to specify exactly what such a system should look like. However, there are certified energy systems whose use can be worthwhile. Since January 1, 2013, for example, certified energy management has been a prerequisite for claiming tax relief under Section 55 of the Energy Tax Act and Section 10 of the Electricity Tax Act.
There are various standards for the certification of energy management systems:
- The international standard is ISO 50001, which came into force in Germany as DIN EN ISO 50001 in 2012. It regulates the requirements that an energy management system must fulfill to be certified.
- Certification can also be obtained via the EU environmental management seal of approval EMAS, which is based on ISO 14001. However, care must be taken here, as EMAS can cover a large part of the requirements for systematic energy management, but does not automatically fulfill the requirements of DIN EN ISO 50001.
- A third option can be a certification company for the certification of management systems. These are verified by the Deutsche Akkreditierungsstelle GmbH (DAkkS). The DAkkS offers an overview of accredited offices online.
The operational energy management of ISO 50001 follows the PDCA cycle, which is also used by various other management systems. This facilitates implementation in a possibly already existing system. The acronym PDCA stands for a dynamic, repetitive model – Plan, Do, Check and Act – with which energy consumption can be repeatedly reassessed and optimized in four phases. The goal is to continuously reduce energy-related costs.
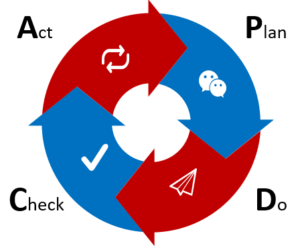
PDCA cycle
- Plan: Establish energy-saving goals, define strategy, define measures and responsibilities, provide necessary resources, establish an action plan.
- Do: Introduce management structures to maintain a continuous process, implement improvement measures (e.g., efficient technologies/procedures).
- Check: Review of the degree of target achievement and the effectiveness of the energy management system, collection of new ideas via energy audit, involvement of an external expert if necessary.
- Act: Strategic optimization by summarizing current energy data, audit results, and new findings, assessing progress against current energy market data, deriving new targets.
Industry 4.0 und energy management
As Industry 4.0 moves from concept to reality, the focus is on energy efficiency. 22% of global greenhouse gas emissions come from industry, according to epa.gov. By implementing energy management in the industry, we can begin to manage emissions and costs. The good news is that energy efficiency is easy to measure and therefore optimize. The savings potential of energy efficiency initiatives is definable, clear, and achievable.
Various studies have shown that energy management systems can save up to 20% of annual energy costs for companies. They also ensure that the entire process is more efficient and easier to execute from a management perspective. Industry 4.0 introduces the concept of smart factories. The physical systems in the factory are wirelessly connected to the Internet of Things, communicating and cooperating and with human operators to perform their functions.
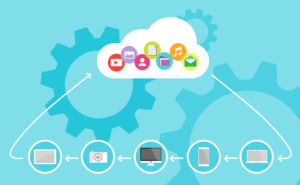
The producing machines, components and products can collect and share data in real time. The main result is a shift from centralized control to a decentralized intelligent system.
This diagram gives a good overview of the basic architecture:
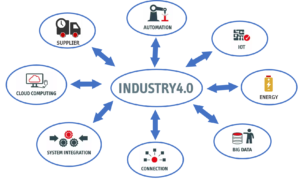
Probably most important is the fact that information flows in such a system move in many different directions. This increases the communication potential exponentially. With so much data available, the optimization opportunity is dramatically increased. There are unlimited opportunities for IoT to influence this optimization process. But how exactly does energy management work in an Industry 4.0 environment?
Here are the core components:
- Measure energy flows and consumption
- Identify imbalances and areas for improvement
- Baseline – understand what energy flows should look like and send alerts when they are not in balance
- Control components to balance loads and control costs remotely
The beauty of Industry 4.0 is that the work has been done, which leads to a return on investment, especially in terms of energy management. For producers to remain competitive, implementing these systems is a must. And with such a great opportunity to reduce overall CO2 emissions, now is the time to implement Industry 4.0. So Industry 4.0 needs energy management.
Large, energy-intensive companies around the world have made significant progress in implementing operational and technical changes to realize their energy efficiency potential. However, this potential remains largely untapped for SMEs – although they make up 99% of all businesses on the planet. For this reason, we at wobe-systems have joined forces with the Christian-Albrechts-University of Kiel (CAU) in the titan funding project to develop the titan Control Center, which shows companies and energy service providers the hidden energy savings potential through various measures in real-time. But more on that later.
Enough reasons for energy management in industrial SMEs
Industrial and commercial enterprises in Germany account for a good 40% of the country’s total energy consumption. An energy expert once referred to energy efficiency in industrial SMEs as the “sleeping giant of the energy turnaround”. More than 90% of the manufacturing companies in Germany make up the industrial SME sector. There are enough reasons why energy management is important in industrial SMEs and what potential it can uncover.
An energy management system enables the systematic recording of all consumption within a company. Based on the recorded data, there is the possibility of an in-depth analysis of electricity consumption. Depending on the system, this allows questions about power consumption per workpiece or the occurrence of a load peak to be analyzed. In the future, new sophisticated analysis algorithms will also make it possible to minimize downtimes through the early detection of faults or wear. The analysis of deviations in the energy data provides the basis for the early detection of possible machine failures due to defects or wear.
But why should a medium-sized company acquire an energy management system?
√ Saving costs
The new transparency provided by the collected data offers the possibility to identify unrecognized consumers. Experience with our customers shows that the typical savings potential lies in reduced transformer losses, unnoticed standby loads, and avoidable load peaks. For example, the typical savings potential in energy costs after the introduction of an energy management system is 5%-20%. The lower cost level thus also increases the competitiveness of an industrial company.
√ Productivity increase
By definition, productivity in production increases when the output quantity rises in relation to the input quantity. The result is that more is produced with the same input of resources. An energy management system offers the possibility to measure the amount of energy flowing into production and thus uncover weak points that lead to unnecessary additional consumption. Our experience in medium-sized companies shows the following typical weak points that stand in the way of efficient production:
- Equipment and operating times above demand
- Lack of controlling of energy costs
- Unrecognized maintenance requirements
√ Troubleshooting for critical operating conditions
With the help of an energy management system, operating states can be monitored via the recorded power consumption. If it is necessary for certain equipment, such as pumps, to be permanently in operation and a failure is to be avoided, the energy management system helps to ensure this. Also, the power quality, i.e. the supply quality of the power supplier, can be monitored and possible problems in the voltage quality, for example, harmonics, can be detected. Furthermore, the risk of fire can be reduced by monitoring the neutral conductor currents.
√ Saving resources
Saving resources is one of the direct consequences of reduced and more efficient energy consumption. This is not only reflected in the company’s electricity bill but also benefits the environment.
√ Facilitation of the energy audit through continuous energy management
In the context of the adopted energy turnaround, energy audits at companies are gaining importance for the legislator. Even if small and medium-sized companies are excluded from the obligation to conduct an energy audit, the energy audit is the prerequisite for tax benefits. An existing energy management system significantly simplifies the implementation of energy audits. The energy audit provides the recording of energy data in preparation for the on-site inspection by the energy auditor. By implementing an energy management system, the relevant data for the audit are already available and can be made easily available to the auditor.

√ Higher data accuracy
The continuous collection of energy data in high resolution provides the possibility of a more detailed analysis compared to a selective manual collection. The availability of high-resolution data over a longer period makes it possible to learn from historical consumption and derive targeted measures. For example, it is possible to determine the optimum maintenance time (Predective Maintenance) for a machine based on historical data and thus minimize potential downtimes in production.
Energy management – Consumption follows generation
The realization of Industry 4.0 and the Internet of Things offers a great opportunity to implement the energy transition and the associated efficiency improvements. Conservation of resources and control of energy consumption is part of the change process. In companies, this should involve an overall energy concept for all areas. Developments and real applications of the digital factory according to the Industry 4.0 concept show that significant improvements are possible in the way energy is used and consumed. Flexible work processes, fully automated predictable production, transparency of data, and scale economies allow fine control.
In this context, just in time applies not only to manufacturing but also to the precise use of energy. Digitalization provides the basis for an energy management concept. Smart Grid (intelligent power grid) and Smart Metering (intelligent electricity meters) enable a precise breakdown of consumption costs. To take advantage of Industry 4.0 and the Internet of Things for the right use of energy, a smart grid, and smart meter are prerequisites. In these frameworks, Smart Grid networks electricity generators, electricity consumers, and electricity storage systems with each other. Internet-based communication in real time is possible.
Data can be interpreted in all directions. Broken down by where they originate, consumption at what time of day or night, by devices and machines, detailed total consumption by type and source of electricity, and supplier. For example, consumption is based on generation. Connected electricity storage knows when they collect electricity or feed electricity into the grid.
Special challenges – analysis and conversion in existing buildings
Conversions of production processes within the framework of Industry 4.0 do not only take place in the form of complete new installations. Factories that are technically up to date are also being transferred to the fully digitized world. A thorough inventory and analysis of energy technology is an important part of technology conversion. This can be a task for external specialists, whose commitment is worthwhile from the ongoing savings. In this environment, new business models have emerged in the course of digitalization.
Specialized energy consulting companies offer engineering services that take a close look at the entire energy requirement. The goal is to utilize all potentials. This approach is often worthwhile for companies, as no investment is required. Payment is based on the number of kilowatt-hours saved (euros per kWh). Another innovation reveals the business model of implementing energy management in the form of Software as a Service (SaaS). External specialists contract out the entire energy complex.
Centralized data collection and evaluation by an engineer focused on energy efficiency lead to more in-depth analyses that extend into proposals for new and replacement investments to reduce energy costs. At eye level with management, they are focused on added value. A reduction in energy consumption can be determined and controlled based on absolute figures. Effective for complex processes is the use of correlation analysis. Optimizations carried out are established and integrated into a continuous improvement process. True efficiency is achieved when a holistic concept takes precedence over monitoring and engineering.
Energy management software unties the knot on Big Data
Processed energy data form the basis for application concepts that are available in visualized form. Reporting tools provide concrete indications of potential savings and calculate models that show strategies for greater efficiency. In the context of all-encompassing energy management, the main focus is on a holistic concept. Both management and the operator on the shop floor are informed and guided in an integrated system.
In many companies here, the energy audit is already standard. In times of Big Data, the mere management of data is outdated. Data is increasingly the core of value creation for all industries: “Data is the new oil”. High-quality systems no longer deliver endless columns of numbers; instead, they are analyzed, sorted, organized, and interpreted in a qualified manner within the overall contex (Business Intelligence). Appropriate networking ultimately overcomes different locations, production lines, subsidiaries, and partners.
Open-source integration platform titan and the titan Control Center
Back in Frank Höpcke’s meeting room. The managing director sketches his ideas on a white sheet of paper. It’s about a simple heating circuit with a three-way valve, heating pump, sensors for flow and return temperature, with a heat meter and an electric meter. And now the Meter-Bus (M-Bus), the Fieldbus for recording consumption data, comes into play. In the future, the sensor and measurement data will then be linked to the titan open-source integration platform via an M-Bus gateway.
So far, so good. While Frank Höpcke is still putting the rest of the information on paper, I have opened the energy management test instance of the titan Control Center in the meantime.
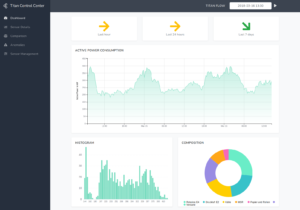
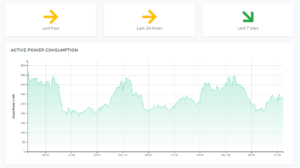
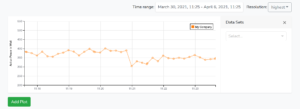
In the titan Control Center, energy consumers, sensors, or energy meters are arranged in a hierarchical model. The energy consumers are grouped in groups (plants/machines/sensors) and further in superordinate groups. All energy data can be displayed currently and also historically over predefined time windows. An exact trend display is also possible via arrow symbols. The displayed area can be reduced or enlarged via a mouse scroll. Other diagrams are primarily intended to show load peaks. Frank Höpcke watches intently.
I explain the “composition” diagram to my business partner. It shows how, for example, the electricity consumption of a group is divided among its subgroups (machines). The purpose of this visualization is to see which consumers are responsible for the company’s electricity consumption and to what extent. Frank Höpcke asks about the diagrams “Weekly Course” and “Daily Course”. These diagrams show the average consumption of the group (machine) for a week or a day. Conclusion: This content thus makes it possible to identify daily or weekly patterns.
For example, one could recognize that consumption is always rather low on a Wednesday morning and then try to schedule high-consumption tasks to this time to obtain a more balanced overall consumption. It would also be possible to identify unknown consumers if consumption is always higher at certain times than at others, without there being an obvious reason for this.
Frank Höpcke continues to follow my comments with interest. The “Comparison” view allows us to relate different consumers/groups to each other. For this purpose, one or more synchronized diagrams are displayed, each of which can show one or more machines (groups). The purpose of this view is to determine possible dependencies from the correlation.
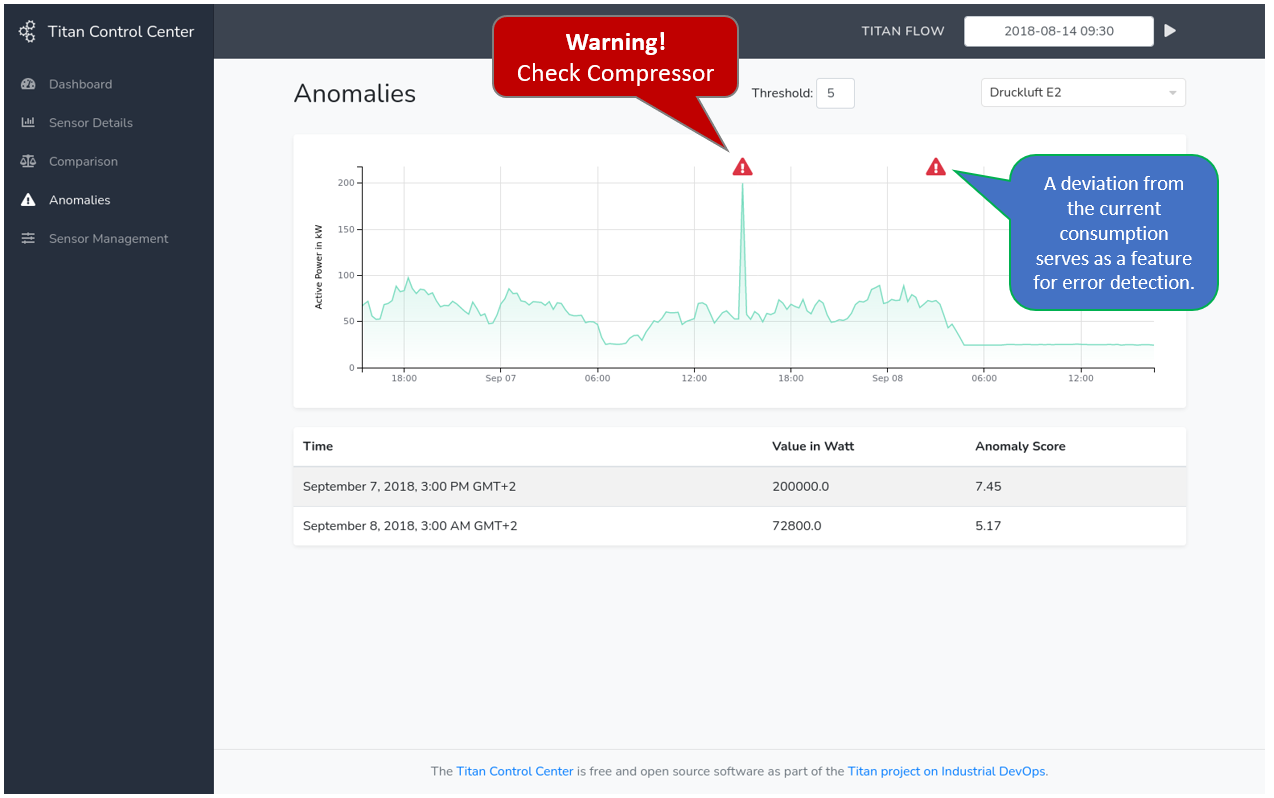
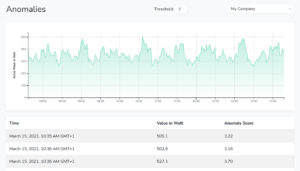
The titan Control Center also has a software component that detects anomalies in consumption data. This applies to both “real” machine data and aggregated data for groups of machines. Primarily, anomaly detection serves as a measure of fault detection. When faults occur in devices, machines, or production processes, they simply do not behave normally. Anomalous behavior of power consumption can therefore indicate a fault that is occurring. It is often not sufficient to detect anomalies in power consumption solely in terms of time.
The power consumption of many devices is subject to external influences such as temperature and, especially in production environments, the operating times of machines do not follow daily or weekly patterns. Therefore, correlating power consumption with environmental, operational, and scheduling data helps to detect anomalies. Also, anomaly detection awakens optimization potential for plant operators and predictive maintenance. It also supports the reporting of power consumption behavior.
“Can any data be integrated into the titan Control Center using the open-source integration platform titan via the flow editor, the engine?” “Yes, this is very easy via No-Code programming and the flow-based configuration in titan.
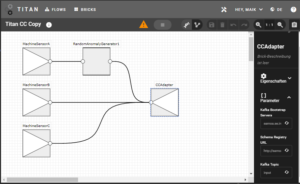
The results of the titan Control Center, such as the anomalies or aggregations mentioned earlier, can be processed further in the titan Flow Editor. Thus, a flow can be used to trigger a messenger service or send an email when an anomaly is detected.”
Energy management provides an overview
The need for energy management is increasing in companies. With ISO 50001 and corresponding software systems, effective tools are now available. It is not only digitalization that is causing upheaval in companies. Topics such as sustainability and climate protection are also driving those responsible. Companies in the industry are increasingly setting out to work in a more resource-conserving and energy-efficient manner. The German government’s climate package, in which the CO2 price was set higher than originally thought, has provided additional momentum. This also increases the demand for solutions that support companies in managing their energy consumption.
Frank Höpcke and I are certain at the end of the day. This decision will significantly increase the demand for energy management systems because it can save a lot of energy and thus also CO2. Especially in the energy-intensive industry, the optimization of processes as well as load management are the driving motives to invest more in energy management solutions than before. The basis for successful energy management is data. Only if this data is available in sufficient quantities and as accurately as possible can the corresponding systems use it to create useful analyses. It is good that we at wobe-systems have a special solution for this in our portfolio with the open-source integration platform titan and the titan Control Center.
Links
https://link.springer.com/article/10.1007/s42488-021-00043-5
https://www.haufe.de/thema/energiemanagement/
https://blog.smart-cost.com/die-industrie-4-0-braucht-energiemanagement/
https://www.industrie40-info.de/verbrauch-folgt-der-erzeugung
https://industrieanzeiger.industrie.de/technik/energiemanagement-sorgt-fuer-ueberblick/